5. Dashboard
With ICAS Security Dashboard®, you can see at a glance how your key information assets are currently protected and drill-down into security workflows – to identify areas of weakness and non-compliance. This information can also be useful for improving operational efficiency and directing meaningful investment.
5.1. Assurance
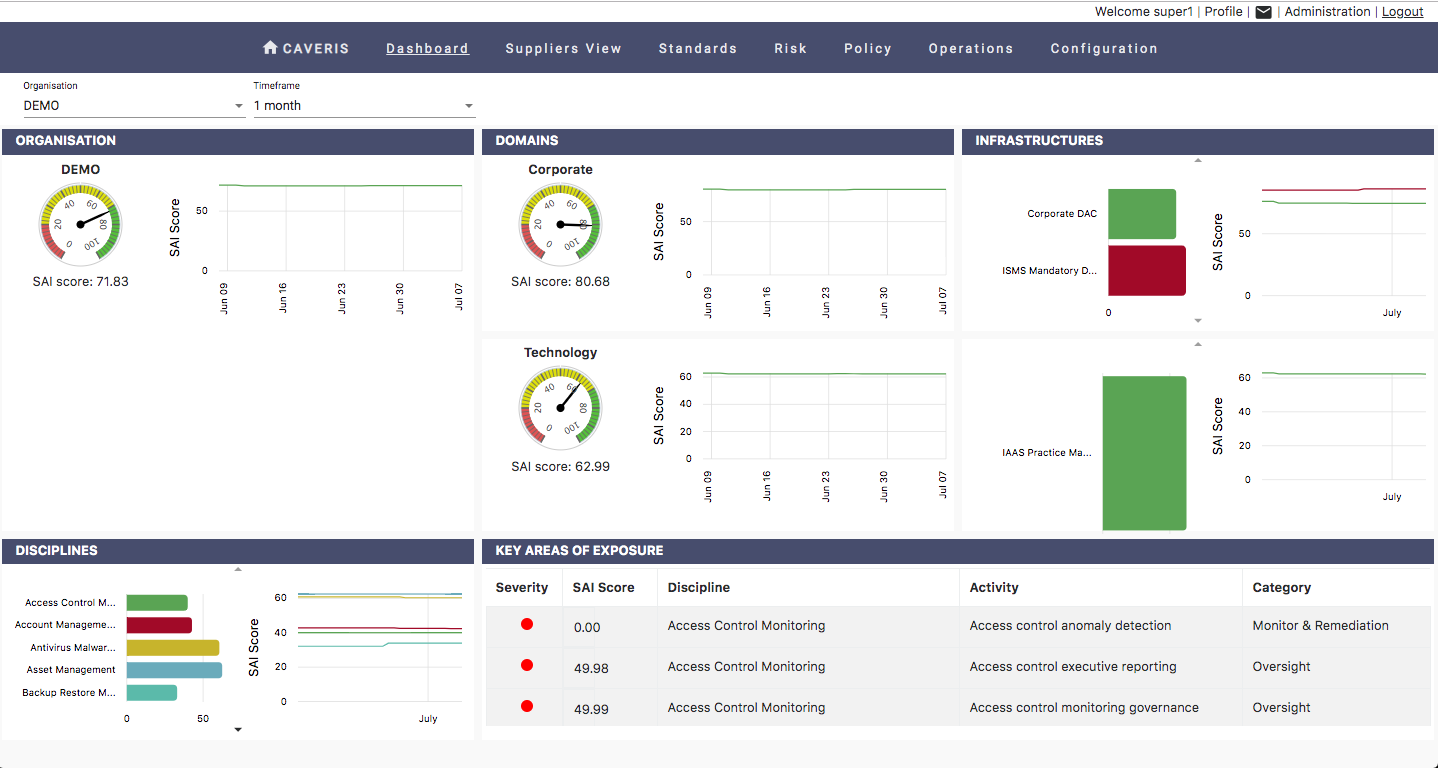
This is where you see how well your organisation is enforcing Information Security. Dials and graphs are used to present current and historical scores. See how your Security Assurance Index score has changed over the previous periods (1 month, 3 months, 6 months, 1 year); Understand which areas are performing poorly & which are performing well and Understand your major areas of exposure.
The Assurance page is broken down into five major sections to give a concise high level overview of the security posture of the Organisation at differing levels. The User is presented with information shown at the following levels:
- Organisation
- Domains
- Infrastructures
- Disciplines
The User is also presented with a Key Areas of Exposure section that shows areas of current weakness within the Organisation from a security posture standpoint. These areas are presented with information from the Activity level.
5.1.1. Timeframe
By choosing the Timeframe drop down, the User can cycle through the following timeframes to present information spread over a given time period:
1 month
3 months
6 months
1 year
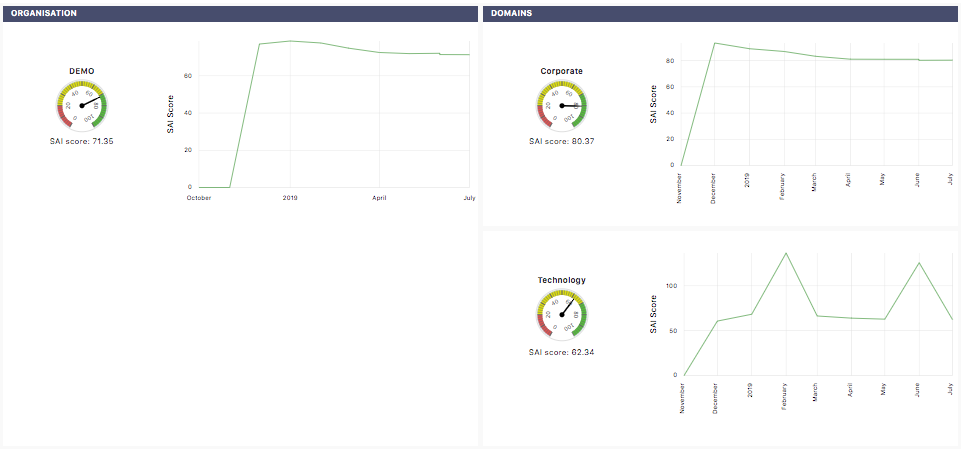
5.1.2. Organisation/ Domains
The Organisation and Domain sections present the User with a dial and line graph pairing respectively showing SAI scores. The User can hover over the line graph to see an exact score for a given point in time.
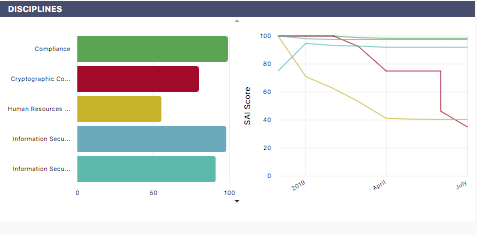
5.1.3. Infrastructures/ Disciplines
The Infrastructure and Discipline sections present the User with a bar and line graph pairing respectively showing SAI scores. The User can hover over the line graph to see an exact score for a given point in time.
By clicking on the Infrastructure bars, the User can change the information that is presented within the Discipline and Key Areas of Exposure sections. Similarly, by clicking on the Discipline bars the information presented within the Key Areas of Exposure section will change accordingly.
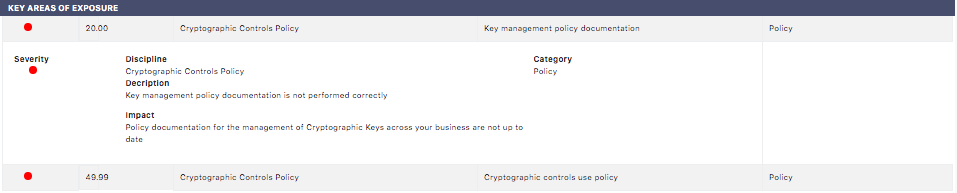
5.1.4. Key Areas of Exposure
By clicking on a Key area of Exposure the User can drill down further to see more information regarding the selected Activity.
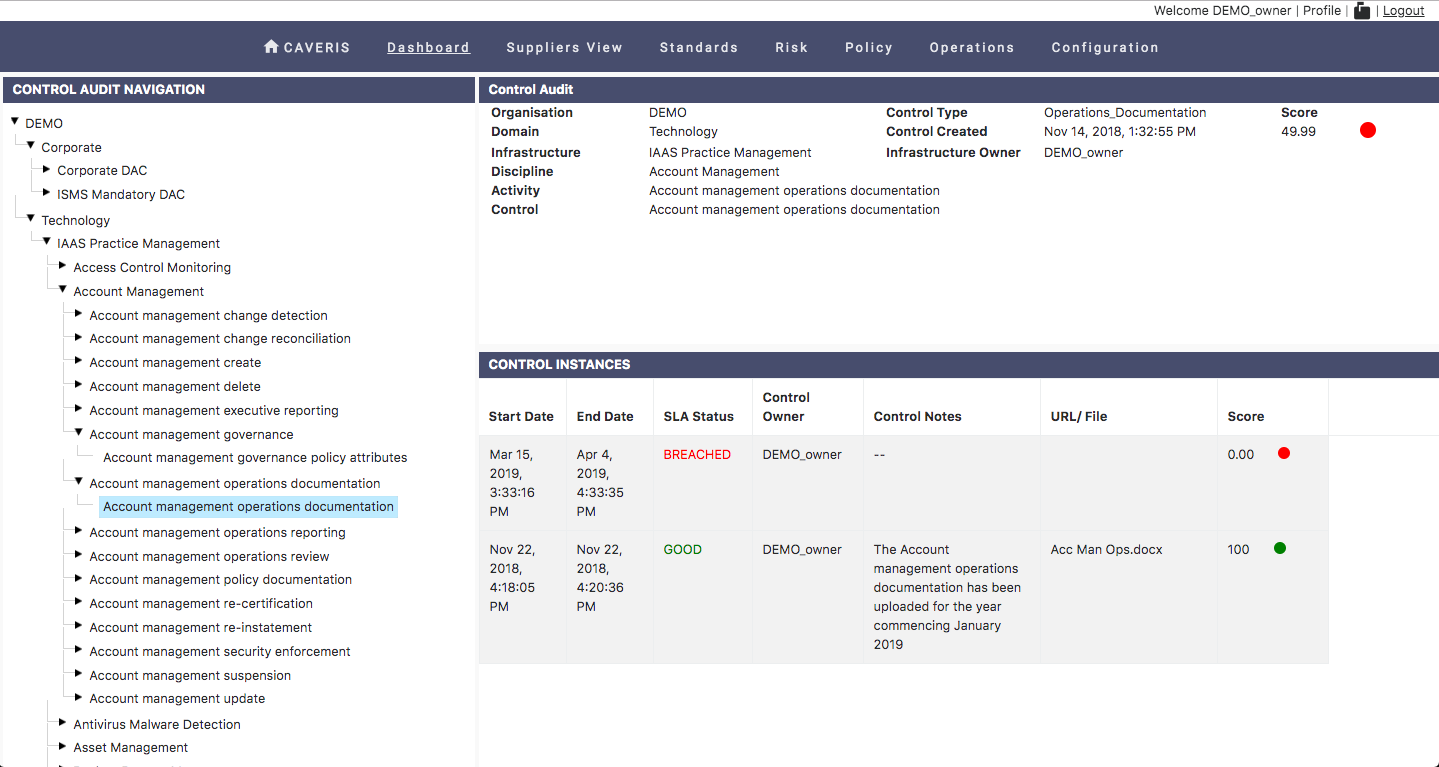
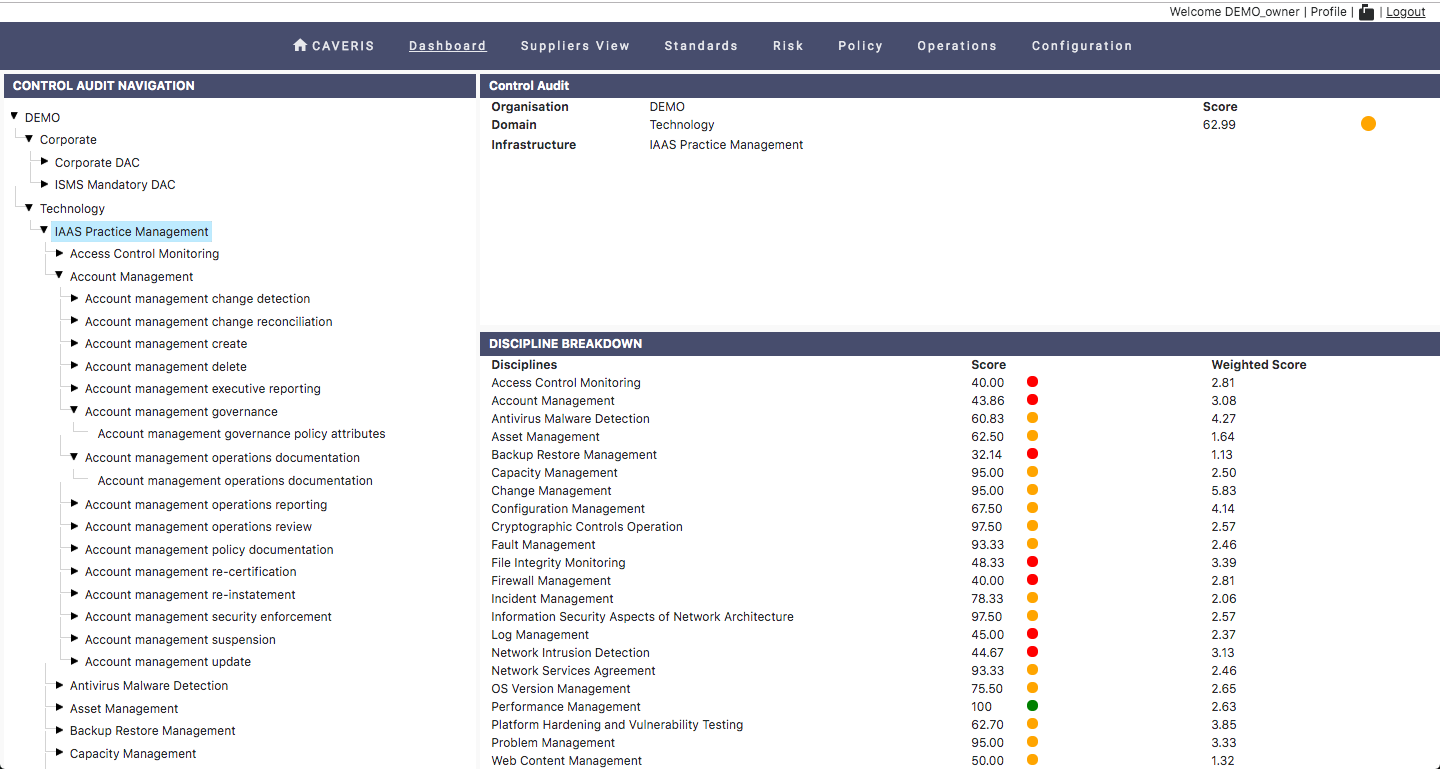
5.2. Control Audit
This is where management can see the full audit trail for all Security Controls tracked within ICAS. This is where you see the evidential proof that substantiates your organisation’s Security Assurance Index score – when a Control Instance was run, by whom, if it completed successfully and other information relevant to the specific Control.
The Control Audit page gives the User the ability to see more detailed information than is presented within the Assurance page by further drilling down through the hierarchical tree. By working their way down the hierarchical tree the User will be presented with increasingly detailed information relating to a progressively specific area of the Organisation.
From the Organisation level down to the Activity level the user will be presented with SAI and weighted score pairings.
Once at the Control level the user will be presented with detailed overviews of the any completed and/ or terminated Controls that combine together to create the scoring seen at the Activity level and above.
Information presented for the Controls includes:
- Start and End Dates
- SLA Status
- Control Owner
- Control Notes
- Documentation
- Score