5.1.2. Organisation/ Domains
The Organisation and Domain sections present the User with a dial and line graph pairing respectively showing SAI scores. The User can hover over the line graph to see an exact score for a given point in time.
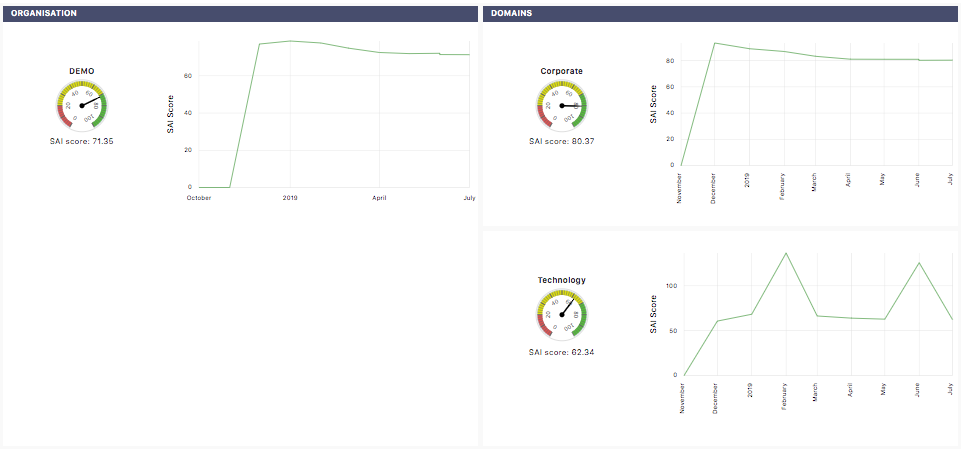
Above: Assurance page Organisation/ Domains shown from a 1 year Timeframe